|
Name
Cash Bids
Market Data
News
Ag Commentary
Weather
Resources
|
Why 3-Day Loser Philip Morris (PM) Could Be the Market’s Gift for Bullish Speculators
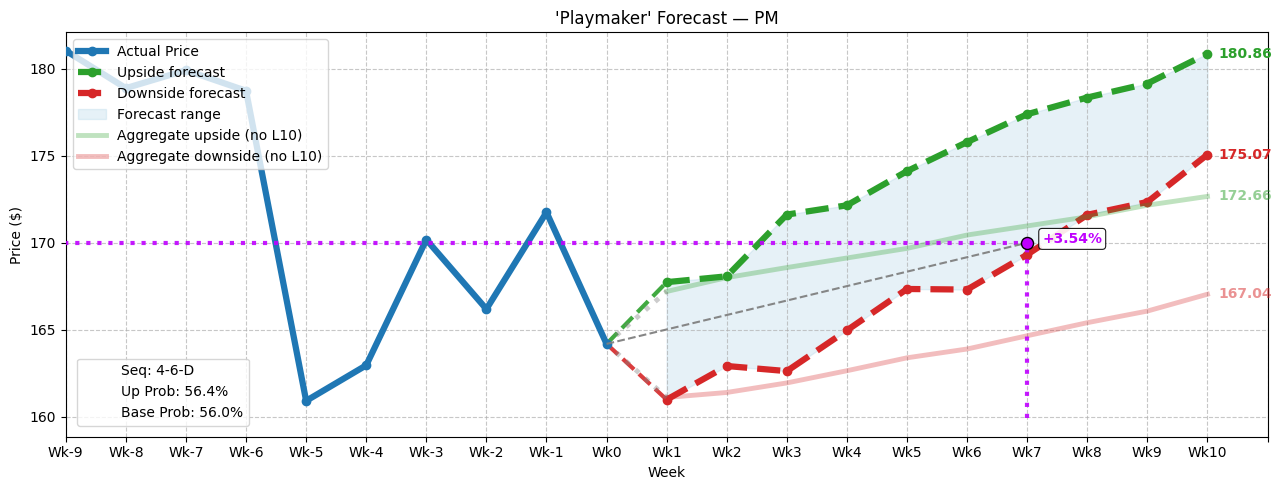
In theory, Barchart’s Three Day Losers screener represents an excellent place to springboard research into potentially discounted securities. Of course, the main barrier is the lack of probabilistic confidence in determining which outcome will materialize. Typically, securities tend to fall faster and harder than they rise; thus, demand for protective puts is usually greater than interest in speculative calls. For PM stock, the concern for volatility protection is understandable. In the past three days, PM stock declined nearly 2%. In the past five sessions, it’s dipped just over 5%. Last month, the tobacco giant posted adjusted earnings of $1.91 per share for the second quarter, beating Wall Street analysts’ consensus target of $1.85. However, revenue of $10.14 billion missed the consensus view of $10.32 billion. Following the disclosure, PM stock tumbled badly, implying that amid a difficult economic environment, investors were opting for the relative safety of cash. Since hitting an apparent bottom on July 28, PM has shot higher, though the performance has been choppy. Thus, it’s not terribly surprising that anxiety still clouds Philip Morris, making it one of the “loser” enterprises. Generally speaking, it may be wiser to sit this one out, or for advanced traders, to consider going long volatility. According to Barchart’s Expected Move calculator — which estimates a high/low range for a given options chain — the Oct. 17 expiration date features an upper projected price of $174.31 and a lower price of $154.08. From peak to trough, that’s a massive 13.13% gap over the next seven weeks — quite a bit for a boring tobacco enterprise. Still, amid the chaos, PM stock may have printed a quantitative signal that points to a possible sentiment reversal. Pathway-Dependent Analytics Present a Possible Mispricing for PM Stock OptionsWhile the Expected Move calculator could potentially be used to decipher directional clues, arguably its best use stems from its ability to identify how market makers are pricing risk. As a retail trader, your job is typically (outside of relatively rare exceptions) to speculate on a direction. On the other end, market makers provide liquidity. It’s a much more difficult job than it sounds on paper because market makers must attempt to balance their books amid a dynamic and entropic system. A miscalculation in hedging risk on either side could be catastrophic. Of course, these specialists do a great job for the most part. But every now and then, certain ideas fall through the cracks. Wall Street prices risk primarily through volatility-based analytics. Really, volatility is the lingua franca of the Street. This is one of the reasons why pathway-dependent analytics is so fascinating. Rather than engaging in complex stochastic calculus derived from the Black-Scholes-Merton formula or other mechanics, pathway dependency simply looks at what has conditionally happened in the past — and projects out what could happen in the future. However, in order to facilitate conditional probabilities, stock market data must be converted from its native continuous scalar signal (share price) to discrete events (net accumulative or distributive sessions). Otherwise, one would have to artificially bin numbers into discrete categories, creating distortions. Now, for the past 10 weeks, the market voted to buy PM stock four times and sell six times, leading to an overall downtrend. For classification purposes, this sequence can be called 4-6-D. What’s fascinating is that when the 4-6-D sequence flashes, 10 weeks later, the drift tends to swing upward: a median upper price of $180.86 and a median lower price of $175.07. Assuming no particular sequence, the normal 10-week drift of PM stock implies an upper median price of $172.66 and a lower median price of $167.04.  Stated differently, market makers — per the Expected Move calculator — are pricing upside risk for the Oct. 17 options chain based on what would normally be expected from PM stock’s organic drift. However, they view the downside risk at a draconian $154.08. The risk premium could be excessive because this negative outcome — based on pathway-dependent analysis — may be unlikely to materialize. If so, the calls are relatively cheap, which could be very appealing for bullish speculators. A Bull Call Spread Shines Above the OthersWith the market intelligence above, the one trade that arguably makes the most sense is the 165/170 bull call spread expiring Oct. 17. This transaction involves buying the $165 call and simultaneously selling the $170 call, for a net debit paid of $230 (the most that can be lost in the trade). If PM stock rises through the short strike price $170 at expiration, the maximum profit is $270, a payout of over 117%. Why this spread over the others? By the Oct. 17 expiration date, the downside target of the 4-6-D pathway intersects with the upside target of the normal baseline pathway. From Wednesday’s close, PM stock would need to rise by 3.54% — which is very doable from recent pricing data. Further, the reason why the payout is so robust compared to the theoretical likelihood of success is that again, market makers are paying heavily for downside protection. This protection may be unnecessary, opening the door for opportunistic traders. On the date of publication, Josh Enomoto did not have (either directly or indirectly) positions in any of the securities mentioned in this article. All information and data in this article is solely for informational purposes. For more information please view the Barchart Disclosure Policy here. |
|
|